In this Neighbourhood Guide, you'll find out more about the people who live here as well as the schools, parks and recreation facilities, homes, and more.
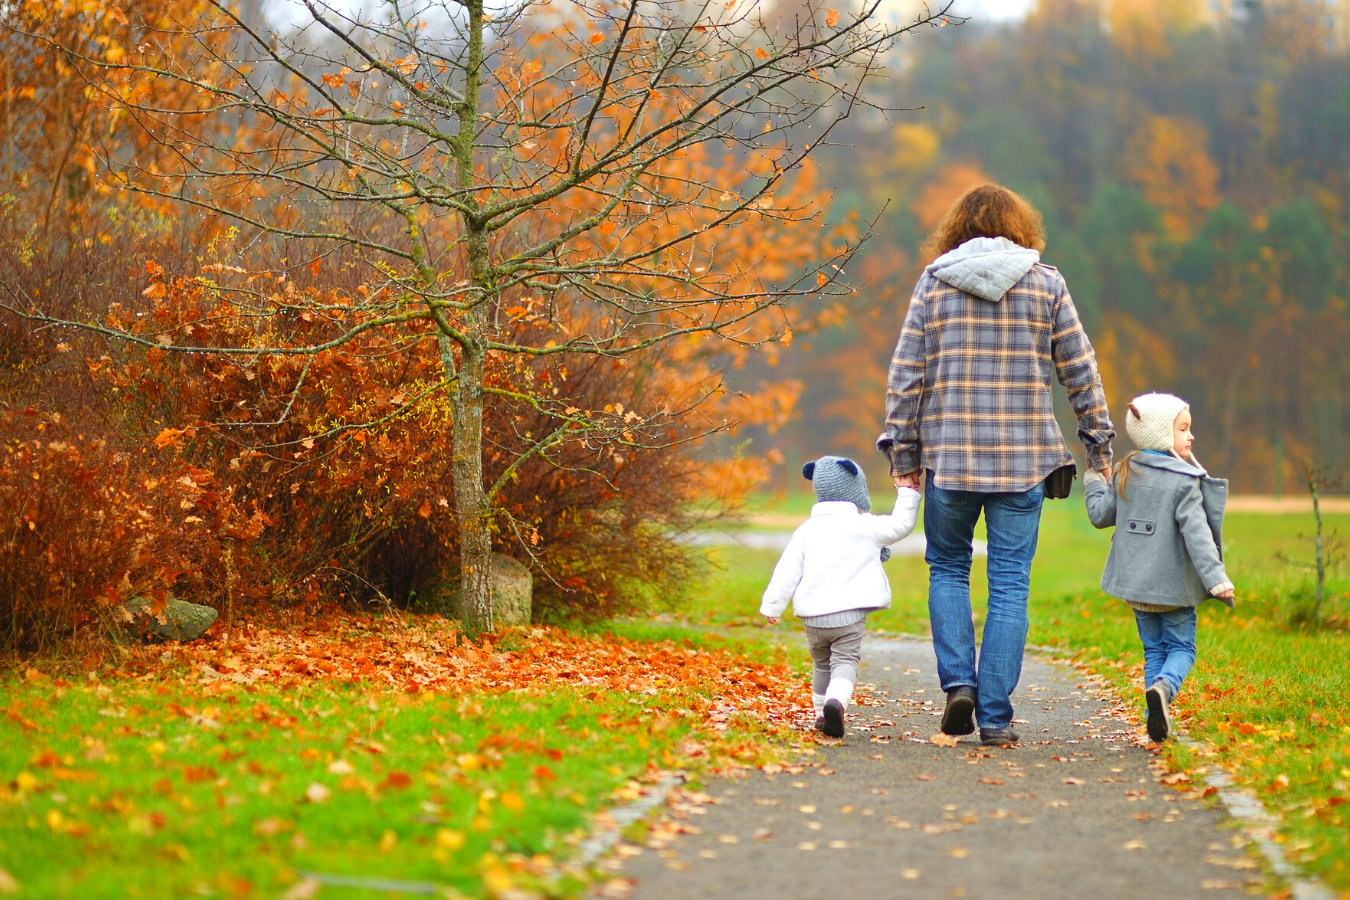
Englemount-Lawrence is a family-friendly neighbourhood with a strong sense of community.
Homes in Englemount-Lawrence are mostly condos and apartments, with a mix of older houses.
Englemount-Lawrence is home to a diverse community with a mix of different ethnic origins.
You'll love the abundance of parks, schools, and recreational facilities in Englemount-Lawrence.
This neighbourhood has a consistent population, and is popular with families with kids under 5, families with kids aged 5 to 9, families with teens, people in their 30s, and people in their 40s. Englemount-Lawrence contains the area known as Lawrence Manor. Retail stores line much of the area on the west side of Bathurst Street. Lawrence Plaza at Bathurst and Lawrence caters to the area and opened in 1953. On the side streets west of Bathurst are mainly residential single homes and lowirise apartments. The area east of Bathurst to Yonge is home to the more wealthy part of Lawrence Manor and the community is home to a number of Orthodox Jewish organizations and religious centres.
People & Families in Englemount-Lawrence
Families with kids make up 44% of households in this neighbourhood, while couples without children make up 15% of households and 34% of households are one person living alone. People in Englemount-Lawrence come from 144 different ethnic origins, and 49% are first-generation immigrants, while 35% are second-generation immigrants.
Neighbourhood Households
8,245
Neighbourhood Population
22,372
Household Size
- 1 person - 34%
- 2 persons - 24%
- 3 persons - 15%
- 4 persons - 11%
- 5 or more persons - 14%
Household Types
- One-person households - 34%
- Non-family households - 4%
- Families with children - 43%
- Couples without children - 15%
- Multiple families in household - 2%
Children Per Family
- 1 child - 31%
- 2 children - 22%
- 3 or more children - 20%
Broad Age Ranges
- 0 to 14 years - 21%
- 15 to 64 years - 61%
- 65 years and over - 16%
Most Common Ethnic Origins
- Filipino - 18%
- Polish - 16%
- Canadian - 11%
- Russian - 9%
- Jewish - 8%
Age of Primary Household Maintainer
- 15 to 24 years - 1%
- 25 to 34 years - 12%
- 35 to 44 years - 19%
- 45 to 54 years - 19%
- 55 to 64 years - 18%
- 65 to 74 years - 12%
- 75 to 84 years - 9%
- 85 years and over - 7%
Specific Age Groups
- 0 to 4 years - 7%
- 5 to 9 years - 7%
- 10 to 14 years - 6%
- 15 to 19 years - 7%
- 20 to 29 years - 11%
- 30 to 39 years - 12%
- 40 to 49 years - 12%
- 50 to 59 years - 11%
- 60 to 69 years - 9%
- over 70 years - 9%
Englemount-Lawrence Schools
Englemount-Lawrence has elementary special programs and secondary special programs. There are 8 public schools, 5 Catholic schools, and 4 private schools serving Englemount-Lawrence. The special programs offered at local schools include International Baccalaureate, French Immersion, Jewish, Montessori, All-Female, Advanced Placement, Fine Arts, and All-Male.
Public Schools
8
Catholic Schools
5
Private Schools
4
Public
Catholic
Having Fun in Englemount-Lawrence
Fun is easy to find at the many parks & rec facilities here. Parks in this neighbourhood feature playgrounds for kids, sports parks, and skating. There are 11 parks in this neighbourhood, with 31 recreational facilities in total. The average number of facilities per park is 2.
Number of Parks
11
Number of Recreation Facilities
31
Recreation Facilities in Neighbourhood Parks
- Playgrounds - 8
- Pool - 1
- Arena - 1
- Rink - 1
- Tennis Courts - 6
- Ball Diamonds - 2
- Sports Field - 1
- Track - 1
- Community Centres - 3
- Skateboard Park - 1
- Sports Court - 1
- Trails - 2
- Fitness/Weight Rooms - 2
- Gym - 1

As part of our mission to help you with home affordability, we are actively searching for special offers from Canada's best mortgage providers. Watch this space!
Getting Around in Englemount-Lawrence
There are 135 transit stops in Englemount-Lawrence. Rail stations include Eglinton West Station. In Englemount-Lawrence, there are a mix of vehicle and transit commuters and most commute within the city.
Commute Destination for Residents
- Commute within the city - 86%
- Commute to another city - 14%
Commute Types
- Vehicle - 45%
- Transit - 44%
- Walk/bike - 6%
Commute Times of Residents
- 15 to 29 minutes - 23%
- 30 to 44 minutes - 30%
- 45 to 59 minutes - 17%
- 60 minutes and over - 13%
- Less than 15 minutes - 16%
Work and Education in Englemount-Lawrence
In this neighbourhood, 44% of adult residents hold a bachelor's degree or higher and 72% have any postsecondary education. The health care and social assistance industry is the most common for residents.
Household Income
- Under $30,000 - 22%
- $30,000 to $39,999 - 8%
- $40,000 to $49,999 - 7%
- $50,000 to $59,999 - 9%
- $60,000 to $69,999 - 6%
- $70,000 to $79,999 - 6%
- $80,000 to $89,999 - 5%
- $90,000 to $99,999 - 3%
- $100,000 to $124,999 - 7%
- $125,000 to $149,999 - 4%
- $150,000 to $199,999 - 5%
- $200,000 and over - 9%
Most Common Occupations (Top 3)
- Sales and service occupations - 25%
- Occupations in education, law and social, community and government services - 20%
- Business, finance and administration occupations - 16%
Most Common Industries (Top 3)
- Health care and social assistance - 13%
- Professional, scientific and technical services - 10%
- Educational services - 10%
Employment
- Employed - 57% of people over age 15 are employed
- Unemployed - 5% are unemployed
- Not in the labour force - 37% are retired, students, homemakers, etc.
Englemount-Lawrence Homes
In this neighbourhood, there are mostly condos and apartments. Englemount-Lawrence has a consistent population, with 38% of households having moved within the past 5 years and 11% having moved within the past year. It has mostly older homes and is a mix of owner and renter-occupied.
Home Types
- Single-detached house - 23%
- Semi-detached house - 0%
- Duplex - 5%
- Row house - 3%
- Low-rise apartment/condo - 30%
- High-rise apartment/condo - 36%
Condominium Status
- Condominium - 21%
- Not condominium - 78%
Number of Bedrooms in Homes
- 1 bedroom - 29%
- 2 bedrooms - 29%
- 3 bedrooms - 20%
- No bedrooms - 2%
- 4 or more bedrooms - 18%
Period of Home Construction
- 1961 to 1980 - 30%
- 1981 to 1990 - 10%
- 1991 to 2000 - 11%
- 2001 to 2005 - 8%
- 2006 to 2010 - 2%
- 2011 to 2016 - 5%
- 1960 or before - 30%
Renters & Owners
- Owner - 41%
- Renter - 58%