In this Neighbourhood Guide, you'll find out more about the people who live here as well as the schools, parks and recreation facilities, homes, and more.
Grindstone is a rural area with parkland, acreages, and new developments, attracting families and retirees.
Mostly detached homes, older with mature trees, featuring open concept layouts and granite counters.
A community popular with families and couples.
Great schools, parks with playgrounds and dog parks, and easy access to highways.
This neighbourhood has a consistent population, and is popular with people in their 50s, people in their 60s, people in their 70s, and people over 80. Grindstone is a mostly rural area in the west end of Burlington, containing parkland, acreages, undeveloped land, and some new developments.
People & Families in Grindstone
Families with kids make up 41% of households in Grindstone, while couples without children make up 40% of households and 15% of households are one person living alone. People in Grindstone come from 40 different ethnic origins, and 24% are first-generation immigrants, while 23% are second-generation immigrants.
Neighbourhood Households
615
Neighbourhood Population
1,818
Household Size
- 1 person - 14%
- 2 persons - 43%
- 3 persons - 18%
- 4 persons - 16%
- 5 or more persons - 8%
Household Types
- One-person households - 14%
- Non-family households - 2%
- Families with children - 41%
- Couples without children - 39%
- Multiple families in household - 2%
Children Per Family
- 1 child - 23%
- 2 children - 17%
- 3 or more children - 8%
Broad Age Ranges
- 0 to 14 years - 10%
- 15 to 64 years - 57%
- 65 years and over - 31%
Most Common Ethnic Origins
- English - 29%
- Scottish - 24%
- Canadian - 23%
- Irish - 22%
- French - 13%
Age of Primary Household Maintainer
- 15 to 24 years - 0%
- 25 to 34 years - 6%
- 35 to 44 years - 8%
- 45 to 54 years - 20%
- 55 to 64 years - 27%
- 65 to 74 years - 22%
- 75 to 84 years - 12%
- 85 years and over - 3%
Specific Age Groups
- 0 to 4 years - 3%
- 5 to 9 years - 3%
- 10 to 14 years - 4%
- 15 to 19 years - 5%
- 20 to 29 years - 8%
- 30 to 39 years - 6%
- 40 to 49 years - 10%
- 50 to 59 years - 14%
- 60 to 69 years - 15%
- over 70 years - 21%
Grindstone Schools
This neighbourhood has great elementary schools, great secondary schools, elementary special programs, and secondary special programs. There are 7 public schools, 9 Catholic schools, 3 private schools, and 1 alternative/special school serving this neighbourhood. The special programs offered at local schools include French Immersion, Christian, Advanced Placement, and Special Education School.
Public Schools
7
Catholic Schools
9
Private Schools
3
Public
Catholic
Alternative/Special
Having Fun in Grindstone
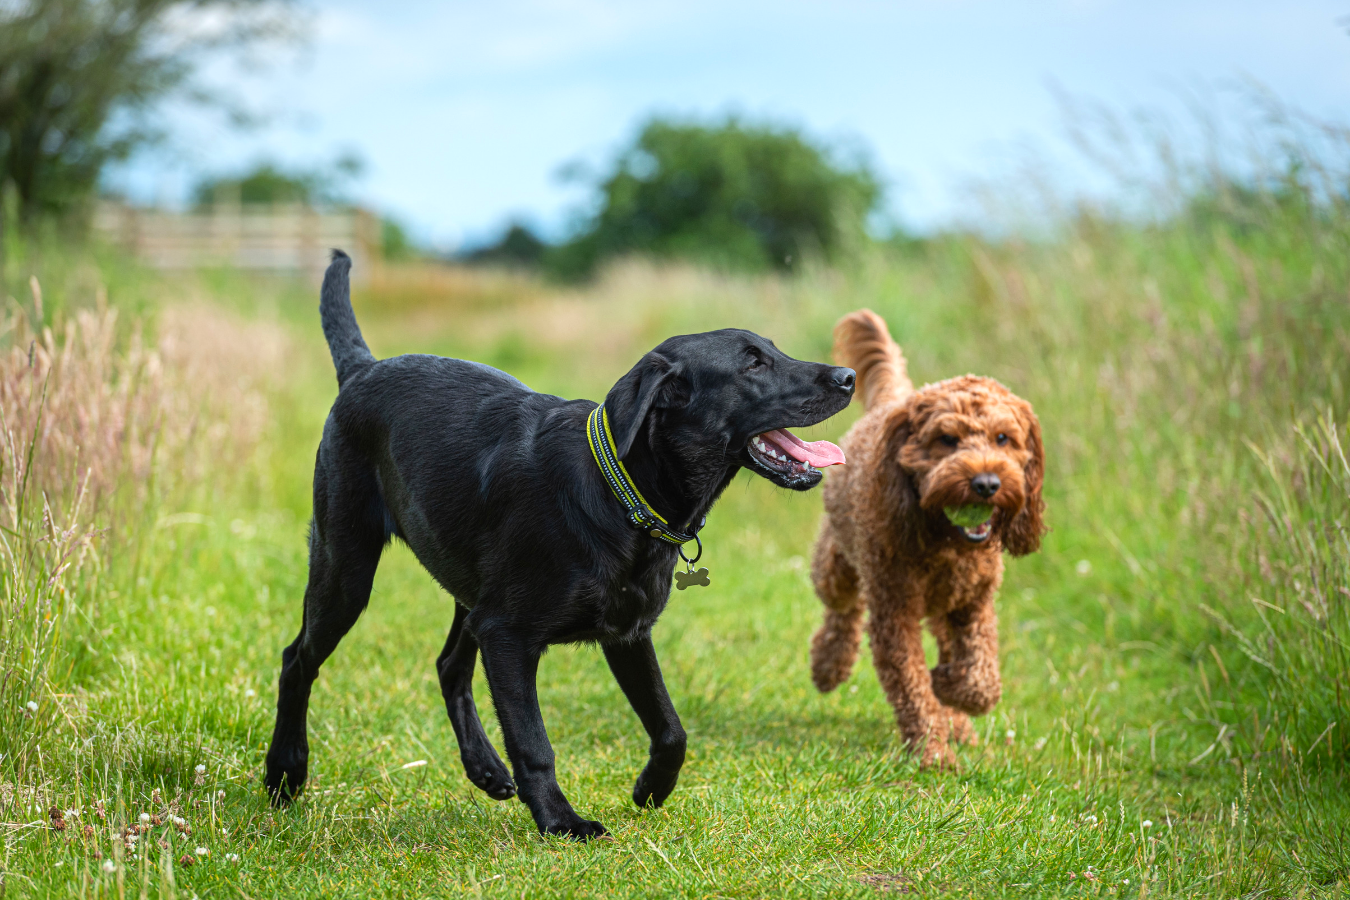
Fun is easy to find at the parks here. Parks in this neighbourhood feature playgrounds for kids and dog parks. There are 4 parks in this neighbourhood, with 12 recreational facilities in total. The average number of facilities per park is 3.
Number of Parks
4
Number of Recreation Facilities
12
Recreation Facilities in Neighbourhood Parks
- Playgrounds - 2
- Dog Park - 1
- Ball Diamond - 1
- Sports Fields - 3
- Outdoor Games Facility - 1
- Shooting Range - 1
- Trails - 3

As part of our mission to help you with home affordability, we are actively searching for special offers from Canada's best mortgage providers. Watch this space!
Getting Around in Grindstone
There are 92 transit stops in Grindstone. Rail stations include Aldershot. In this neighbourhood, there are mostly vehicle commuters and a mix of commuting within and outside the city.
Commute Destination for Residents
- Commute within the city - 43%
- Commute to another city - 58%
Commute Types
- Vehicle - 89%
- Transit - 5%
- Walk/bike - 0%
Commute Times of Residents
- 15 to 29 minutes - 41%
- 30 to 44 minutes - 16%
- 45 to 59 minutes - 12%
- 60 minutes and over - 9%
- Less than 15 minutes - 21%
Work and Education in Grindstone
In this neighbourhood, 41% of adult residents hold a bachelor's degree or higher and 78% have any postsecondary education. The health care and social assistance industry is the most common for residents.
Household Income
- Under $30,000 - 2%
- $30,000 to $39,999 - 2%
- $40,000 to $49,999 - 3%
- $50,000 to $59,999 - 4%
- $60,000 to $69,999 - 4%
- $70,000 to $79,999 - 7%
- $80,000 to $89,999 - 5%
- $90,000 to $99,999 - 4%
- $100,000 to $124,999 - 13%
- $125,000 to $149,999 - 9%
- $150,000 to $199,999 - 16%
- $200,000 and over - 21%
Most Common Occupations (Top 3)
- Sales and service occupations - 22%
- Business, finance and administration occupations - 19%
- Management occupations - 16%
Most Common Industries (Top 3)
- Health care and social assistance - 11%
- Retail trade - 11%
- Professional, scientific and technical services - 10%
Employment
- Employed - 56% of people over age 15 are employed
- Unemployed - 4% are unemployed
- Not in the labour force - 40% are retired, students, homemakers, etc.
Grindstone Homes
In Grindstone, there are mostly detached homes. Grindstone has a consistent population, with 33% of households having moved within the past 5 years and 8% having moved within the past year. It has mostly older homes and is mostly owner-occupied.
Home Types
- Single-detached house - 76%
- Semi-detached house - 6%
- Duplex - 0%
- Row house - 17%
- Low-rise apartment/condo - 0%
- High-rise apartment/condo - 0%
Condominium Status
- Condominium - 16%
- Not condominium - 83%
Number of Bedrooms in Homes
- 1 bedroom - 3%
- 2 bedrooms - 20%
- 3 bedrooms - 46%
- No bedrooms - 0%
- 4 or more bedrooms - 30%
Period of Home Construction
- 1961 to 1980 - 16%
- 1981 to 1990 - 1%
- 1991 to 2000 - 35%
- 2001 to 2005 - 6%
- 2006 to 2010 - 5%
- 2011 to 2016 - 1%
- 1960 or before - 35%
Renters & Owners
- Owner - 90%
- Renter - 9%