In this Neighbourhood Guide, you'll find out more about the people who live here as well as the schools, parks and recreation facilities, homes, and more.
A suburban community with a consistent population, popular with families and higher-income residents.
Mostly detached homes, a mix of older and newer homes, with attractive features like heated floors and hardwood floors.
A diverse community with residents from 68 different ethnic origins, and a strong sense of community.
Great schools, parks with playgrounds, and a peaceful and family-friendly atmosphere.
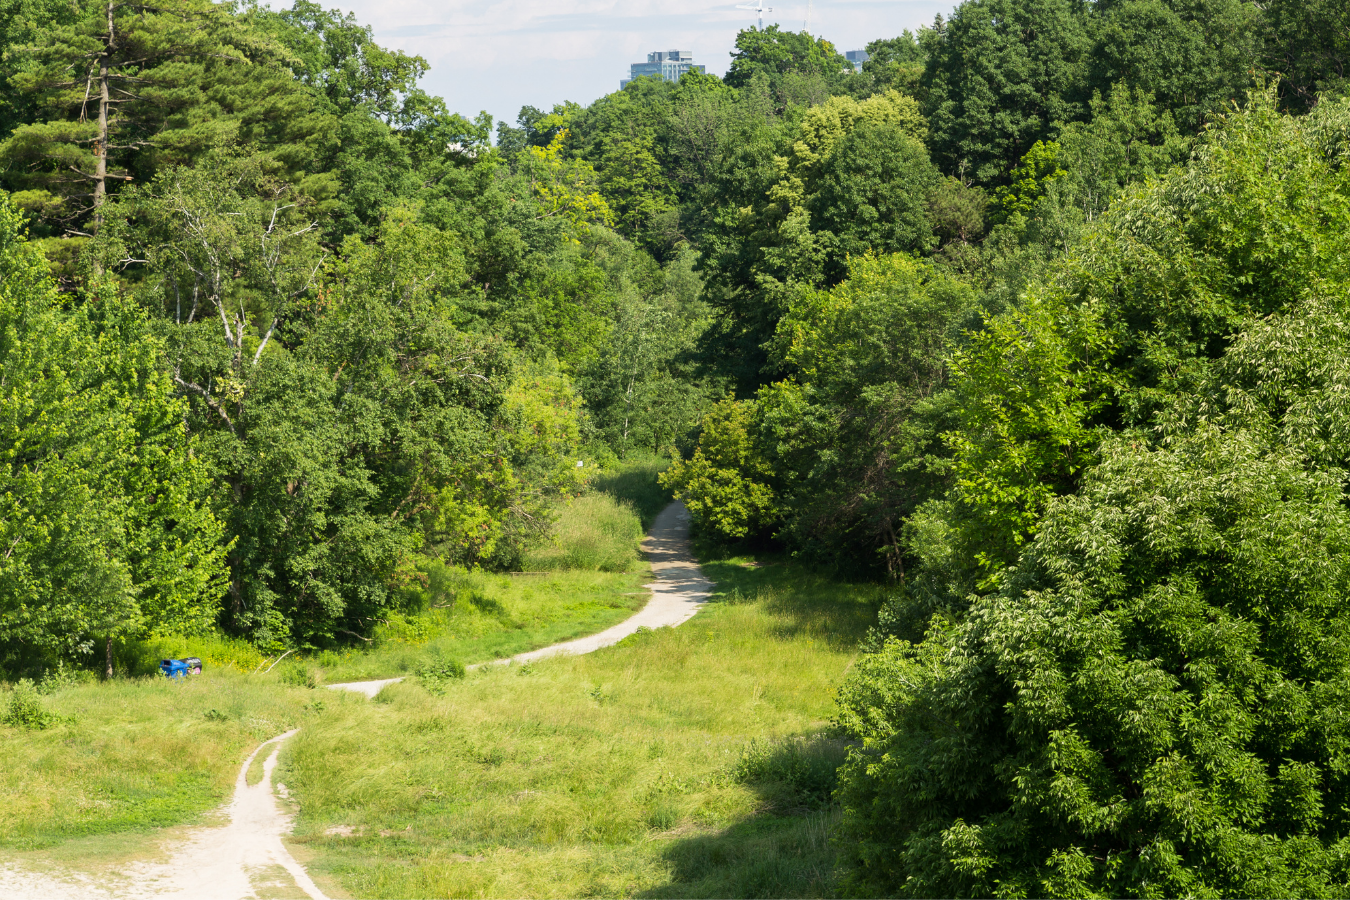
This neighbourhood has a consistent population, is higher income, and is popular with families with teens, people in their 40s, people in their 50s, and people in their 60s. Palgrave is a suburban community in the Town of Caledon. Palgrave is situated on the Oak Ridges Moraine, a 160 km long ridge of hilly terrain created by retreating glaciers depositing large quantities of sand and gravel sediments. The moraine is a primary source for many river systems in this part of southern Ontario. Palgrave was originally called Buckstown after Brian Dolan, nicknamed Barney or Buck. He managed the Western Hotel after it was built in 1846. In 1869, postal authorities renamed the community Palgrave. Small housing developments were built around Palgrave in the 1950s, followed by estate home development and subdivisions beginning in the late 1960s.
People & Families in Palgrave
Families with kids make up 54% of households in Palgrave, while couples without children make up 30% of households and 9% of households are one person living alone. People in Palgrave come from 68 different ethnic origins, and 23% are first-generation immigrants, while 34% are second-generation immigrants.
Neighbourhood Households
1,180
Neighbourhood Population
3,829
Household Size
- 1 person - 8%
- 2 persons - 32%
- 3 persons - 17%
- 4 persons - 23%
- 5 or more persons - 18%
Household Types
- One-person households - 8%
- Non-family households - 0%
- Families with children - 54%
- Couples without children - 30%
- Multiple families in household - 4%
Children Per Family
- 1 child - 20%
- 2 children - 27%
- 3 or more children - 15%
Broad Age Ranges
- 0 to 14 years - 16%
- 15 to 64 years - 68%
- 65 years and over - 14%
Most Common Ethnic Origins
- English - 25%
- Italian - 22%
- Scottish - 20%
- Canadian - 18%
- Irish - 13%
Age of Primary Household Maintainer
- 15 to 24 years - 0%
- 25 to 34 years - 1%
- 35 to 44 years - 15%
- 45 to 54 years - 28%
- 55 to 64 years - 27%
- 65 to 74 years - 16%
- 75 to 84 years - 8%
- 85 years and over - 2%
Specific Age Groups
- 0 to 4 years - 3%
- 5 to 9 years - 4%
- 10 to 14 years - 8%
- 15 to 19 years - 8%
- 20 to 29 years - 10%
- 30 to 39 years - 5%
- 40 to 49 years - 15%
- 50 to 59 years - 18%
- 60 to 69 years - 12%
- over 70 years - 7%
Palgrave Schools
This neighbourhood has great elementary schools, great secondary schools, elementary special programs, and secondary special programs. There are 5 public schools and 5 Catholic schools serving this neighbourhood. The special programs offered at local schools include French Immersion, Advanced Placement, and International Baccalaureate.
Public Schools
5
Catholic Schools
5
Having Fun in Palgrave
Fun is easy to find at the many parks & rec facilities here. Parks in Palgrave feature playgrounds for kids. There are 7 parks in this neighbourhood, with 11 recreational facilities in total. The average number of facilities per park is 1.
Number of Parks
7
Number of Recreation Facilities
11
Recreation Facilities in Neighbourhood Parks
- Playgrounds - 4
- Basketball Courts - 2
- Ball Diamonds - 2
- Sports Field - 1
- Golf Course - 1
- Equestrian Facility - 1

As part of our mission to help you with home affordability, we are actively searching for special offers from Canada's best mortgage providers. Watch this space!
Getting Around in Palgrave
There are 0 transit stops in Palgrave. In Palgrave, there are mostly vehicle commuters and most commute to another city.
Commute Destination for Residents
- Commute within the city - 29%
- Commute to another city - 70%
Commute Types
- Vehicle - 94%
- Transit - 2%
- Walk/bike - 1%
Commute Times of Residents
- 15 to 29 minutes - 23%
- 30 to 44 minutes - 24%
- 45 to 59 minutes - 22%
- 60 minutes and over - 19%
- Less than 15 minutes - 10%
Work and Education in Palgrave
In this neighbourhood, 32% of adult residents hold a bachelor's degree or higher and 68% have any postsecondary education. The retail trade industry is the most common for residents.
Household Income
- Under $30,000 - 0%
- $30,000 to $39,999 - 3%
- $40,000 to $49,999 - 4%
- $50,000 to $59,999 - 3%
- $60,000 to $69,999 - 3%
- $70,000 to $79,999 - 4%
- $80,000 to $89,999 - 4%
- $90,000 to $99,999 - 3%
- $100,000 to $124,999 - 10%
- $125,000 to $149,999 - 9%
- $150,000 to $199,999 - 18%
- $200,000 and over - 29%
Most Common Occupations (Top 3)
- Management occupations - 23%
- Business, finance and administration occupations - 18%
- Sales and service occupations - 14%
Most Common Industries (Top 3)
- Retail trade - 13%
- Manufacturing - 12%
- Construction - 12%
Employment
- Employed - 69% of people over age 15 are employed
- Unemployed - 3% are unemployed
- Not in the labour force - 27% are retired, students, homemakers, etc.
Palgrave Homes
In this neighbourhood, there are mostly detached homes. Palgrave has a consistent population, with 28% of households having moved within the past 5 years and 7% having moved within the past year. It has a mix of older and newer homes and is mostly owner-occupied.
Home Types
- Single-detached house - 97%
- Semi-detached house - 0%
- Duplex - 1%
- Row house - 0%
- Low-rise apartment/condo - 0%
- High-rise apartment/condo - 0%
Condominium Status
- Condominium - 0%
- Not condominium - 99%
Number of Bedrooms in Homes
- 1 bedroom - 0%
- 2 bedrooms - 2%
- 3 bedrooms - 30%
- No bedrooms - 0%
- 4 or more bedrooms - 65%
Period of Home Construction
- 1961 to 1980 - 32%
- 1981 to 1990 - 22%
- 1991 to 2000 - 13%
- 2001 to 2005 - 10%
- 2006 to 2010 - 8%
- 2011 to 2016 - 5%
- 1960 or before - 9%
Renters & Owners
- Owner - 95%
- Renter - 3%