In this Neighbourhood Guide, you'll find out more about the people who live here as well as the schools, parks and recreation facilities, homes, and more.
A family-friendly neighbourhood with ongoing development.
Newer single-detached and semi-detached homes on large and narrow lots, elegant townhomes.
A community of families with kids, couples without children, and diverse ethnic backgrounds.
Great schools, parklands, recreation complex, proximity to Upper Canada Mall and Yonge Street.
Glenway Estates has a consistent population, and is popular with families with teens, people in their 20s, people in their 40s, and people in their 50s. The Glenway Estates neighbourhood is in northwest Newmarket. The area features parklands, a recreation complex, and is just south of the Upper Canada Mall and Yonge Street's big box stores. Housing is newer single-detached homes on large lots, large semi-detached homes, as well as two-storey homes on narrower lots. The area's development is ongoing, with infill projects featuring single-detached homes and elegant townhomes
People & Families in Glenway Estates
Families with kids make up 63% of households in this neighbourhood, while couples without children make up 23% of households and 10% of households are one person living alone. People in this neighbourhood come from 84 different ethnic origins, and 22% are first-generation immigrants, while 26% are second-generation immigrants.
Neighbourhood Households
1,470
Neighbourhood Population
4,583
Household Size
- 1 person - 9%
- 2 persons - 27%
- 3 persons - 21%
- 4 persons - 27%
- 5 or more persons - 13%
Household Types
- One-person households - 9%
- Non-family households - 1%
- Families with children - 63%
- Couples without children - 22%
- Multiple families in household - 3%
Children Per Family
- 1 child - 27%
- 2 children - 32%
- 3 or more children - 11%
Broad Age Ranges
- 0 to 14 years - 16%
- 15 to 64 years - 71%
- 65 years and over - 11%
Most Common Ethnic Origins
- English - 30%
- Irish - 24%
- Canadian - 22%
- Scottish - 20%
- Italian - 9%
Age of Primary Household Maintainer
- 15 to 24 years - 0%
- 25 to 34 years - 4%
- 35 to 44 years - 15%
- 45 to 54 years - 26%
- 55 to 64 years - 32%
- 65 to 74 years - 15%
- 75 to 84 years - 3%
- 85 years and over - 1%
Specific Age Groups
- 0 to 4 years - 4%
- 5 to 9 years - 5%
- 10 to 14 years - 6%
- 15 to 19 years - 7%
- 20 to 29 years - 13%
- 30 to 39 years - 7%
- 40 to 49 years - 13%
- 50 to 59 years - 20%
- 60 to 69 years - 12%
- over 70 years - 4%
Glenway Estates Schools
Glenway Estates has great elementary schools, great secondary schools, elementary special programs, and secondary special programs. There are 5 public schools and 4 Catholic schools serving this neighbourhood. The special programs offered at local schools include French Immersion, Advanced Placement, and International Baccalaureate.
Public Schools
5
Catholic Schools
4
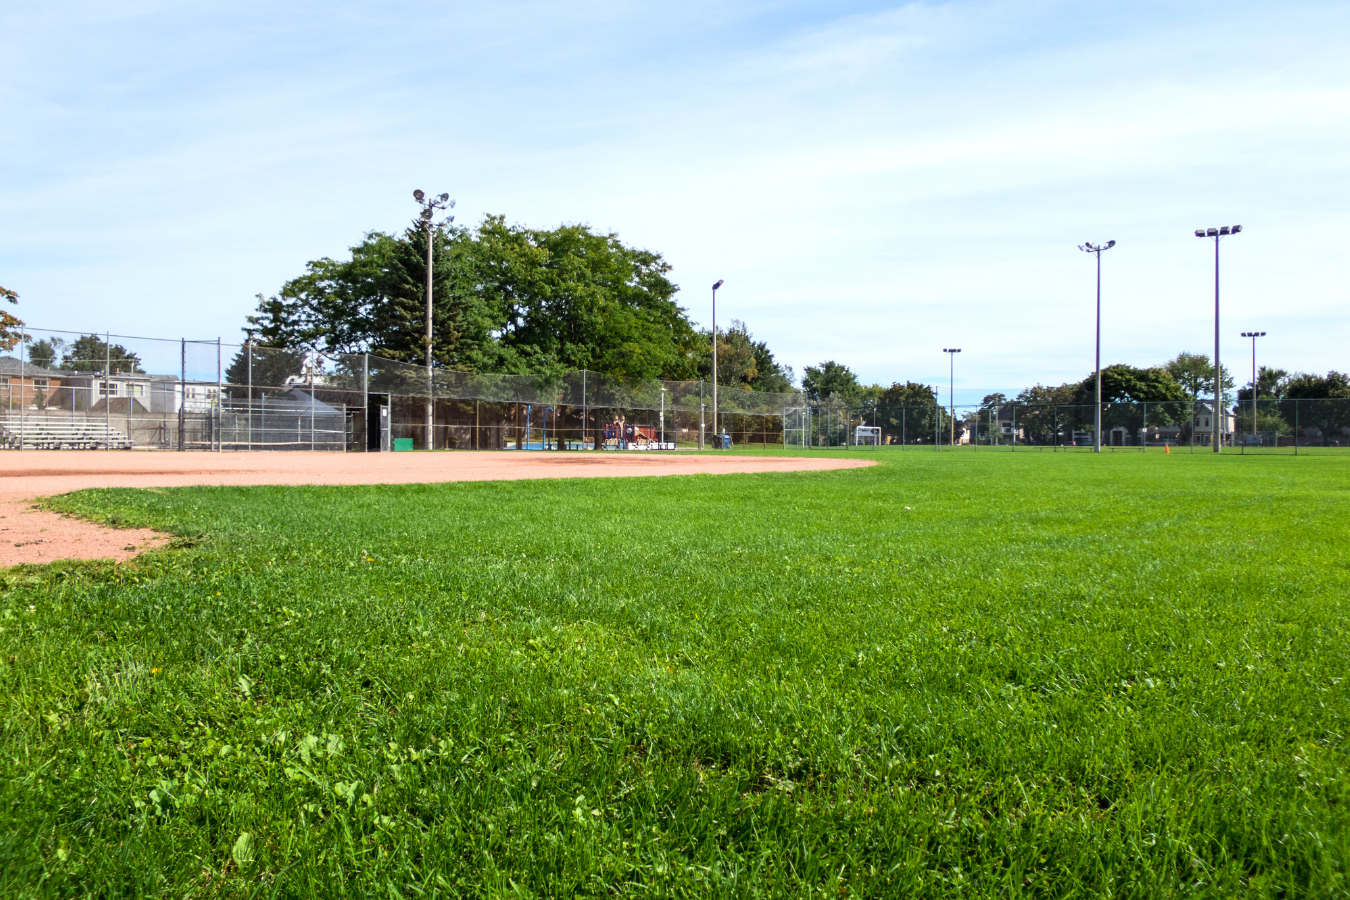
Having Fun in Glenway Estates
Fun is easy to find at the parks here. Parks in Glenway Estates feature playgrounds for kids and skating. There are 2 parks in this neighbourhood, with 14 recreational facilities in total. The average number of facilities per park is 7.
Number of Parks
2
Number of Recreation Facilities
14
Recreation Facilities in Neighbourhood Parks
- Playgrounds - 2
- Pool - 1
- Rinks - 2
- Ball Diamonds - 3
- Sports Fields - 4
- Community Centre - 1
- Trail - 1

As part of our mission to help you with home affordability, we are actively searching for special offers from Canada's best mortgage providers. Watch this space!
Getting Around in Glenway Estates
There are 81 transit stops in this neighbourhood. In this neighbourhood, there are mostly vehicle commuters and most commute to another city.
Commute Destination for Residents
- Commute within the city - 29%
- Commute to another city - 69%
Commute Types
- Vehicle - 86%
- Transit - 8%
- Walk/bike - 3%
Commute Times of Residents
- 15 to 29 minutes - 19%
- 30 to 44 minutes - 22%
- 45 to 59 minutes - 13%
- 60 minutes and over - 20%
- Less than 15 minutes - 24%
Work and Education in Glenway Estates
In Glenway Estates, 40% of adult residents hold a bachelor's degree or higher and 73% have any postsecondary education. The retail trade industry is the most common for residents.
Household Income
- Under $30,000 - 6%
- $30,000 to $39,999 - 4%
- $40,000 to $49,999 - 4%
- $50,000 to $59,999 - 4%
- $60,000 to $69,999 - 4%
- $70,000 to $79,999 - 3%
- $80,000 to $89,999 - 5%
- $90,000 to $99,999 - 4%
- $100,000 to $124,999 - 9%
- $125,000 to $149,999 - 9%
- $150,000 to $199,999 - 16%
- $200,000 and over - 25%
Most Common Occupations (Top 3)
- Sales and service occupations - 23%
- Business, finance and administration occupations - 19%
- Management occupations - 15%
Most Common Industries (Top 3)
- Retail trade - 13%
- Professional, scientific and technical services - 11%
- Educational services - 9%
Employment
- Employed - 66% of people over age 15 are employed
- Unemployed - 5% are unemployed
- Not in the labour force - 28% are retired, students, homemakers, etc.
Glenway Estates Homes
In Glenway Estates, there are mostly detached homes. Glenway Estates has a consistent population, with 30% of households having moved within the past 5 years and 7% having moved within the past year. It has a mix of older and newer homes and is mostly owner-occupied.
Home Types
- Single-detached house - 78%
- Semi-detached house - 0%
- Duplex - 3%
- Row house - 10%
- Low-rise apartment/condo - 0%
- High-rise apartment/condo - 6%
Condominium Status
- Condominium - 0%
- Not condominium - 99%
Number of Bedrooms in Homes
- 1 bedroom - 3%
- 2 bedrooms - 5%
- 3 bedrooms - 27%
- No bedrooms - 0%
- 4 or more bedrooms - 63%
Period of Home Construction
- 1961 to 1980 - 7%
- 1981 to 1990 - 54%
- 1991 to 2000 - 33%
- 2001 to 2005 - 2%
- 2006 to 2010 - 0%
- 2011 to 2016 - 0%
- 1960 or before - 2%
Renters & Owners
- Owner - 81%
- Renter - 18%